XAUUSD Trend Strategy### Description of the XAUUSD Trading Strategy with Pine Script
This strategy is designed to trade gold (**XAUUSD**) using proven technical analysis principles. It combines key indicators such as **Exponential Moving Averages (EMA)**, the **Relative Strength Index (RSI)**, and **Bollinger Bands** to identify trading opportunities in trending market conditions.
---
#### Objective:
To maximize profits by identifying trend-aligned entry points while minimizing risks through well-defined Stop Loss and Take Profit levels.
---
### How It Works
1. **Indicators Used:**
- **Exponential Moving Averages (EMA):** Tracks short-term and long-term trends to confirm market direction.
- **Relative Strength Index (RSI):** Detects overbought or oversold conditions for potential reversals or trend continuation.
- **Bollinger Bands:** Measures volatility to identify breakout or reversion points.
2. **Entry Rules:**
- **Long (Buy):** Triggered when:
- The short-term EMA crosses above the long-term EMA (bullish trend confirmation).
- RSI exits oversold territory (<30), signaling buying momentum.
- The price breaks above the upper Bollinger Band, indicating a strong trend.
- **Short (Sell):** Triggered when:
- The short-term EMA crosses below the long-term EMA (bearish trend confirmation).
- RSI exits overbought territory (>70), signaling selling momentum.
- The price breaks below the lower Bollinger Band, indicating a strong downtrend.
3. **Risk Management:**
- **Stop Loss:** Automatically calculated based on a percentage of equity risk (customizable via inputs).
- **Take Profit:** Defined using a risk-to-reward ratio, ensuring consistent profitability when trades succeed.
4. **Visualization:**
- The chart displays the EMAs, Bollinger Bands, and entry/exit points for clear analysis.
---
### Key Features:
- **Customizable Parameters:** You can adjust EMAs, RSI thresholds, Bollinger Band settings, and risk levels to suit your trading style.
- **Alerts:** Automatic alerts for potential trade setups.
- **Backtesting-Ready:** Easily test historical performance on TradingView.
---
This strategy is ideal for gold traders looking for a systematic, rule-based approach to trading trends with minimal emotional interference.
חפש סקריפטים עבור "relative strength"

5-Minute Buy/Sell SignalThe 5-Minute Buy/Sell Signal Indicator is designed to help short-term traders identify potential buy and sell opportunities on a 5-minute chart using a combination of multiple technical indicators. This indicator integrates the following key components to generate buy and sell signals:
MACD (Moving Average Convergence Divergence):
The MACD helps identify the strength and direction of the market trend by comparing the difference between short-term and long-term moving averages. A positive MACD histogram indicates bullish momentum, while a negative histogram indicates bearish momentum.
RSI (Relative Strength Index):
The RSI is a momentum oscillator that measures the speed and change of price movements. The indicator is used to determine overbought or oversold conditions:
Oversold (below 30): Potential buy signal.
Overbought (above 70): Potential sell signal.
EMA (Exponential Moving Average):
The 50-period EMA is used to determine the prevailing trend. When the price is above the EMA, it indicates a bullish trend; when it is below the EMA, it indicates a bearish trend.
Volume:
The indicator incorporates volume analysis to confirm the strength of signals. Signals are only considered valid when the current volume exceeds the average volume over the last 20 periods, ensuring that there is sufficient market participation to support the move.
Signal Generation:
Buy Signal:
The signal is generated when:
MACD histogram is positive (bullish momentum).
RSI is below the oversold level (indicating a potential reversal).
The price is above the 50-period EMA (indicating an uptrend).
Current volume is higher than the 20-period volume moving average (confirming the strength of the buy signal).
Sell Signal:
The signal is generated when:
MACD histogram is negative (bearish momentum).
RSI is above the overbought level (indicating a potential reversal).
The price is below the 50-period EMA (indicating a downtrend).
Current volume is higher than the 20-period volume moving average (confirming the strength of the sell signal).
Signal Display:
Buy Signal: A green "BUY" label appears below the bar when all buy conditions are met.
Sell Signal: A red "SELL" label appears above the bar when all sell conditions are met.
Usage:
This indicator is specifically designed for 5-minute charts, making it ideal for scalpers and day traders who need quick, reliable signals to trade in short timeframes. By combining multiple indicators—MACD, RSI, EMA, and Volume—the system ensures that the buy or sell signals are well-confirmed, reducing the likelihood of false signals and increasing the probability of successful trades.
Alert Conditions:
Alerts can be set up for both buy and sell signals, enabling traders to be notified when the conditions for a potential trade are met, ensuring they never miss a trading opportunity.
In summary, this indicator provides a comprehensive, multi-faceted approach to identifying buy and sell opportunities, helping traders make more informed decisions based on a detailed technical analysis.
Bewakoof stock indicator**Title**: "Bewakoof Stock Indicator: Multi-Timeframe RSI and SuperTrend Entry-Exit System"
---
### Description
The **Bewakoof Stock Indicator** is an original trading tool that combines multi-timeframe RSI analysis with the SuperTrend indicator to create reliable entry and exit signals for trending markets. This indicator is designed for traders looking to follow strong trends with built-in risk management. By filtering entries through short- and long-term momentum and utilizing dynamic trailing exits, this indicator provides a structured approach to trading.
#### Indicator Components
1. **Multi-Timeframe RSI Analysis**:
- The Relative Strength Index (RSI) is calculated across three timeframes: Daily, Weekly, and Monthly.
- By examining multiple timeframes, the indicator confirms that trends align over short, medium, and long-term intervals, making buy signals more reliable.
- **Buy Condition**: All three RSI values must meet these thresholds:
- **Daily RSI > 50** – indicates short-term upward momentum,
- **Weekly RSI > 60** – signals medium-term strength,
- **Monthly RSI > 60** – confirms long-term trend alignment.
- This filtering process ensures that buy signals are generated only in stable, upward-trending markets.
2. **SuperTrend Confirmation**:
- The SuperTrend (20-period ATR with a multiplier of 2) acts as a trend filter and trailing stop mechanism.
- For a buy condition to be valid, the closing price must be above the SuperTrend level, verifying that the market is trending up.
- The combination of RSI and SuperTrend helps to avoid false signals, focusing only on well-established trends.
#### Trade Signals
- **Buy Signal**: When both the multi-timeframe RSI and SuperTrend conditions are met, a buy signal is triggered, indicated by a “BUY” label on the chart with details:
- **Entry Price**,
- **Initial Stop-Loss** (set at the SuperTrend level for risk control),
- **Target 1** – calculated with a 1:1 risk-reward ratio based on the initial stop-loss,
- **Target 2** – calculated with a 1:2 risk-reward ratio based on the initial stop-loss.
- **Exit Signals**: This indicator provides two exit strategies to protect profits:
1. **Fixed Stop-Loss**: Automatically set at the SuperTrend level at the time of entry to limit risk.
2. **Trailing Exit**: Exits are triggered if the price crosses below the SuperTrend level, adapting to potential trend reversals.
#### Labeling & Alerts
The **Bewakoof Stock Indicator** offers intuitive labeling and alert options:
- **Labels**: Buy and exit points are clearly marked, showing entry, stop-loss, and targets directly on the chart.
- **Alerts**: Custom alerts can be set for:
- **Buy signals** when both conditions are met, and
- **Exit signals** triggered by the stop-loss or trailing exit.
#### Use Case and Benefits
This indicator is ideal for trend-following traders who value risk control and trend confirmation:
- **Stronger Trend Signals**: By requiring RSI alignment across multiple timeframes, this indicator focuses only on trades with strong trend momentum.
- **Dynamic Risk Management**: Using both fixed and trailing exits enables flexible trade management, balancing risk and potential reward.
- **Simple Trade Execution**: The chart labels and alerts simplify trade decisions, making it easy to enter, manage, and exit trades.
#### How to Use
1. **Add** the Bewakoof Stock Indicator to your chart.
2. **Watch** for the "BUY" label as your entry point.
3. **Manage the trade** using the labeled stop-loss and target levels.
4. **Exit** on either a stop-loss hit or when the price crosses below the SuperTrend for a trailing exit.
The **Bewakoof Stock Indicator** is a complete solution for trend-following traders, combining the strength of multi-timeframe RSI with the SuperTrend’s trend-following capabilities. This systematic approach aims to provide high-confidence entries and effective risk management, empowering traders to follow trends with precision and control.

NASI +The NASI + indicator is an advanced adaptation of the classic McClellan Oscillator, a tool widely used to gauge market breadth. It calculates the McClellan Oscillator by measuring the difference between the 19-day and 39-day EMAs of net advancing issues, which are optionally adjusted to account for the relative strength of advancing vs. declining stocks.
To enhance this analysis, NASI + applies the Relative Strength Index (RSI) to the cumulative McClellan Oscillator values, generating a unique momentum-based view of market breadth. Additionally, two extra EMAs—a 10-day and a 4-day EMA—are applied to the RSI, providing further refinement to signals for overbought and oversold conditions.
With NASI +, users benefit from:
-A deeper analysis of market momentum through cumulative breadth data.
-Enhanced sensitivity to trend shifts with the applied RSI and dual EMAs.
-Clear visual cues for overbought and oversold conditions, aiding in intuitive signal identification.

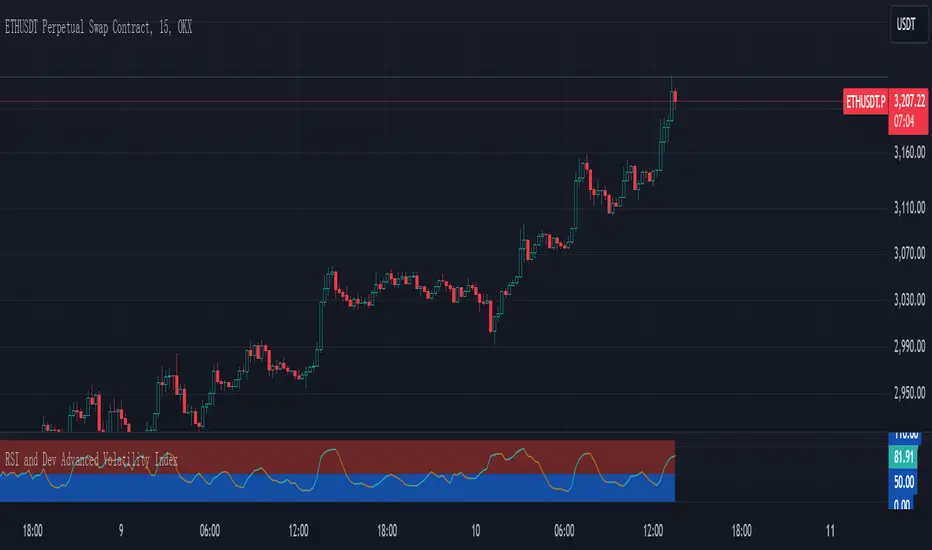
RSI and Dev Advanced Volatility IndexEnglish Explanation of the "RSI and Dev Advanced Volatility Index" Pine Script Code
Understanding the Code
Purpose:
This Pine Script code creates a custom indicator that combines the Relative Strength Index (RSI) and Deviation (DEV) to provide insights into market volatility.
Key Components:
* Deviation (DEV): Calculates the difference between the closing price and the 10-period simple moving average. This measures the extent to which the price deviates from its recent average, indicating volatility.
* RSI: The traditional RSI is then applied to the calculated deviations. This helps to smooth the data and identify overbought or oversold conditions in terms of volatility.
Calculation Steps:
* Deviation Calculation: The difference between the closing price and its 10-period simple moving average is calculated.
* RSI Calculation: The RSI is calculated on the deviations, providing a measure of the speed and change of volatility relative to recent volatility changes.
* Plotting:
* The RSI of the deviations is plotted on the chart.
* Horizontal lines are plotted at 50, 0, and 110 to visually represent different volatility zones.
* The area between the lines is filled with color to highlight low and high volatility regions.
Interpretation and Usage
* Volatility Analysis:
* High Volatility: When the RSI is above 50, it indicates high volatility, suggesting the market might be in a consolidation or trend reversal phase.
* Low Volatility: When the RSI is below 50, it indicates low volatility, suggesting a relatively calm market.
* Trading Signals:
* Buy Signal: When the RSI crosses above 50 from below, it might signal increasing volatility, which could be a buying opportunity.
* Sell Signal: When the RSI crosses below 50 from above, it might signal decreasing volatility, which could be a selling opportunity.
* Risk Management:
* By monitoring volatility, traders can better manage their risk. During periods of high volatility, traders might reduce their position size or adopt more conservative strategies.
Advantages
* Comprehensive: Combines RSI and DEV for a more holistic view of volatility.
* Sensitivity: Quickly responds to changes in market volatility.
* Visual Clarity: Color-coded zones provide a clear visual representation of different volatility levels.
Limitations
* Parameter Sensitivity: The indicator's performance is sensitive to parameter changes, such as the lookback period for the moving average.
* Lag: Like most technical indicators, it has some lag and might not capture every market movement.
* Not Predictive: It can only indicate current and past volatility, not future movements.
Summary
This custom indicator offers a valuable tool for analyzing market volatility. By combining RSI and DEV, it provides a more nuanced perspective on price fluctuations. However, it should be used in conjunction with other technical indicators and fundamental analysis for more robust trading decisions.
Key points to remember:
* Higher RSI values indicate higher volatility.
* Lower RSI values indicate lower volatility.
* Crossovers of the RSI line above or below 50 can provide potential trading signals.
* The indicator should be used in conjunction with other analysis tools for a more complete picture of the market.
MACD+RSI+BBDESCRIPTION
The MACD + RSI + Bollinger Bands Indicator is a comprehensive technical analysis tool designed for traders and investors to identify potential market trends and reversals. This script combines three indicators: the Moving Average Convergence Divergence (MACD), the Relative Strength Index (RSI), and Bollinger Bands. Each of these indicators provides unique insights into market behavior.
FEATURES
MACD (Moving Average Convergence Divergence)
The MACD is a trend-following momentum indicator that shows the relationship between two moving averages of a security’s price.
The script calculates the MACD line, the signal line, and the histogram, which visually represents the difference between the MACD line and the signal line.
RSI (Relative Strength Index)
The RSI is a momentum oscillator that measures the speed and change of price movements. It ranges from 0 to 100 and is typically used to identify overbought or oversold conditions.
The script allows users to set custom upper and lower thresholds for the RSI, with default values of 70 and 30, respectively.
Bollinger Bands
Bollinger Bands consist of a middle band (EMA) and two outer bands (standard deviations away from the EMA). They help traders identify volatility and potential price reversals.
The script allows users to customize the length of the Bollinger Bands and the multiplier for the standard deviation.
Color-Coding Logic
The histogram color changes based on the following conditions:
Black: If the RSI is above the upper threshold and the closing price is above the upper Bollinger Band, or if the RSI is below the lower threshold and the closing price is below the lower Bollinger Band.
Green (#4caf50): If the RSI is above the upper threshold but the closing price is not above the upper Bollinger Band.
Light Green (#a5d6a7): If the histogram is positive and the RSI is not above the upper threshold.
Red (#f23645): If the RSI is below the lower threshold but the closing price is not below the lower Bollinger Band.
Light Red (#faa1a4): If the histogram is negative and the RSI is not below the lower threshold.
Inputs
Bollinger Bands Settings
Length: The number of periods for the moving average.
Basis MA Type: The type of moving average (SMA, EMA, SMMA, WMA, VWMA).
Source: The price source for the Bollinger Bands calculation.
StdDev: The multiplier for the standard deviation.
RSI Settings
RSI Length: The number of periods for the RSI calculation.
RSI Upper: The upper threshold for the RSI.
RSI Lower: The lower threshold for the RSI.
Source: The price source for the RSI calculation.
MACD Settings
Fast Length: The length for the fast moving average.
Slow Length: The length for the slow moving average.
Signal Smoothing: The length for the signal line smoothing.
Oscillator MA Type: The type of moving average for the MACD calculation.
Signal Line MA Type: The type of moving average for the signal line.
Usage
This indicator is suitable for various trading strategies, including day trading, swing trading, and long-term investing.
Traders can use the MACD histogram to identify potential buy and sell signals, while the RSI can help confirm overbought or oversold conditions.
The Bollinger Bands provide context for price volatility and potential breakout or reversal points.
Example:
From the example, it can clearly see that the Selling Climax and Buying Climax, marked as orange circle when a black histogram occurs.
Conclusion
The MACD + RSI + Bollinger Bands Indicator is a versatile tool that combines multiple technical analysis methods to provide traders with a comprehensive view of market conditions. By utilizing this script, traders can enhance their analysis and improve their decision-making process.

Ichimoku + RSI + MACD Strategy1. Relative Strength Index (RSI)
Overview:
The Relative Strength Index (RSI) is a momentum oscillator that measures the speed and change of price movements. It ranges from 0 to 100 and is typically used to identify overbought or oversold conditions in a market.
How to Use with Ichimoku:
Long Entry: Look for RSI to be above 30 (indicating it is not oversold) when the price is above the Ichimoku Cloud.
Short Entry: Look for RSI to be below 70 (indicating it is not overbought) when the price is below the Ichimoku Cloud.
2. Moving Average Convergence Divergence (MACD)
Overview:
The MACD is a trend-following momentum indicator that shows the relationship between two moving averages of a security’s price. It consists of the MACD line, signal line, and histogram.
How to Use with Ichimoku:
Long Entry: Enter a long position when the MACD line crosses above the signal line while the price is above the Ichimoku Cloud.
Short Entry: Enter a short position when the MACD line crosses below the signal line while the price is below the Ichimoku Cloud.
Combined Strategy Example
Here’s a brief outline of how to structure a trading strategy using Ichimoku, RSI, and MACD:
Long Entry Conditions:
Price is above the Ichimoku Cloud.
RSI is above 30.
MACD line crosses above the signal line.
Short Entry Conditions:
Price is below the Ichimoku Cloud.
RSI is below 70.
MACD line crosses below the signal line.
Exit Conditions:
Exit long when MACD line crosses below the signal line.
Exit short when MACD line crosses above the signal line.

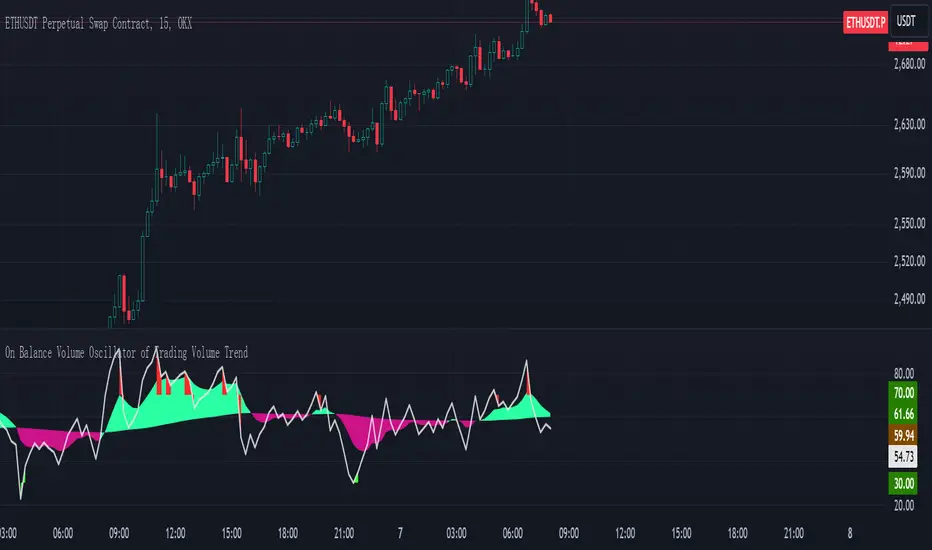
On Balance Volume Oscillator of Trading Volume TrendOn Balance Volume Oscillator of Trading Volume Trend
Introduction
This indicator, the "On Balance Volume Oscillator of Trading Volume Trend," is a technical analysis tool designed to provide insights into market momentum and potential trend reversals by combining the On Balance Volume (OBV) and Relative Strength Index (RSI) indicators.
Calculation and Methodology
* OBV Calculation: The indicator first calculates the On Balance Volume, which is a cumulative total of the volume of up days minus the volume of down days. This provides a running tally of buying and selling pressure.
* RSI of OBV: The RSI is then applied to the OBV values to smooth the data and identify overbought or oversold conditions.
* Exponential Moving Averages (EMAs): Two EMAs are calculated on the RSI of OBV. A shorter-term EMA (9-period in this case) and a longer-term EMA (100-period) are used to generate signals.
Interpretation and Usage
* EMA Crossovers: When the shorter-term EMA crosses above the longer-term EMA, it suggests increasing bullish momentum. Conversely, a downward crossover indicates weakening bullish momentum or increasing bearish pressure.
* RSI Divergences: Divergences between the price and the indicator can signal potential trend reversals. For example, if the price is making new highs but the indicator is failing to do so, it could be a bearish divergence.
* Overbought/Oversold Conditions: When the RSI of OBV is above 70, it suggests the market may be overbought and a potential correction could be imminent. Conversely, when it is below 30, it suggests the market may be oversold.
Visual Representation
The indicator is plotted on a chart with multiple lines and filled areas:
* Two EMAs: The shorter-term EMA and longer-term EMA are plotted to show the trend of the OBV.
* Filled Areas: The area between the two EMAs is filled with a color to indicate the strength of the trend. The color changes based on whether the shorter-term EMA is above or below the longer-term EMA.
* RSI Bands: Horizontal lines at 30 and 70 mark the overbought and oversold levels for the RSI of OBV.
Summary
The On Balance Volume Oscillator of Trading Volume Trend provides a comprehensive view of market momentum and can be a valuable tool for traders. By combining the OBV and RSI, this indicator helps identify potential trend reversals, overbought and oversold conditions, and the strength of the current trend.
Note: This indicator should be used in conjunction with other technical analysis tools and fundamental analysis to make informed trading decisions.
Dynamic Market Correlation Analyzer (DMCA) v1.0Description
The Dynamic Market Correlation Analyzer (DMCA) is an advanced TradingView indicator designed to provide real-time correlation analysis between multiple assets. It offers a comprehensive view of market relationships through correlation coefficients, technical indicators, and visual representations.
Key Features
- Multi-asset correlation tracking (up to 5 symbols)
- Dynamic correlation strength categorization
- Integrated technical indicators (RSI, MACD, DX)
- Customizable visualization options
- Real-time price change monitoring
- Flexible timeframe selection
## Use Cases
1. **Portfolio Diversification**
- Identify highly correlated assets to avoid concentration risk
- Find negatively correlated assets for hedging strategies
- Monitor correlation changes during market events
2. Pairs Trading
- Detect correlation breakdowns for potential trading opportunities
- Track correlation strength for pair selection
- Monitor technical indicators for trade timing
3. Risk Management
- Assess portfolio correlation risk in real-time
- Monitor correlation shifts during market stress
- Identify potential portfolio vulnerabilities
4. **Market Analysis**
- Study sector relationships and rotations
- Analyze cross-asset correlations (e.g., stocks vs. commodities)
- Track market regime changes through correlation patterns
Components
Input Parameters
- **Timeframe**: Custom timeframe selection for analysis
- **Length**: Correlation calculation period (default: 20)
- **Source**: Price data source selection
- **Symbol Selection**: Up to 5 customizable symbols
- **Display Options**: Table position, text color, and size settings
Technical Indicators
1. **Correlation Coefficient**
- Range: -1 to +1
- Strength categories: Strong/Moderate/Weak (Positive/Negative)
2. **RSI (Relative Strength Index)**
- 14-period default setting
- Momentum comparison across assets
3. **MACD (Moving Average Convergence Divergence)**
- Standard settings (12, 26, 9)
- Trend direction indicator
4. **DX (Directional Index)**
- Trend strength measurement
- Based on DMI calculations
Visual Components
1. **Correlation Table**
- Symbol identifiers
- Correlation coefficients
- Correlation strength descriptions
- Price change percentages
- Technical indicator values
2. **Correlation Plot**
- Real-time correlation visualization
- Multiple correlation lines
- Reference levels at -1, 0, and +1
- Color-coded for easy identification
Installation and Setup
1. Load the indicator on TradingView
2. Configure desired symbols (up to 5)
3. Adjust timeframe and calculation length
4. Customize display settings
5. Enable/disable desired components (table, plot, RSI)
Best Practices
1. **Symbol Selection**
- Choose related but distinct assets
- Include a mix of asset classes
- Consider market cap and liquidity
2. **Timeframe Selection**
- Match timeframe to trading strategy
- Consider longer timeframes for strategic analysis
- Use shorter timeframes for tactical decisions
3. **Interpretation**
- Monitor correlation changes over time
- Consider multiple timeframes
- Combine with other technical analysis tools
- Account for market conditions and volatility
Performance Notes
- Calculations update in real-time
- Resource usage scales with number of active symbols
- Historical data availability may affect initial calculations
Version History
- v1.0: Initial release with core functionality
- Multi-symbol correlation analysis
- Technical indicator integration
- Customizable display options
Future Enhancements (Planned)
- Additional technical indicators
- Advanced correlation algorithms
- Enhanced visualization options
- Custom alert conditions
- Statistical significance testing

VolWRSI### Description of the `VolWRSI` Script
The `VolWRSI` script is a TradingView Pine Script indicator designed to provide a volume-weighted Relative Strength Index (RSI) combined with abnormal activity detection in both volume and price. This multi-faceted approach aims to enhance trading decisions by identifying potential market conditions influenced by both price movements and trading volume.
#### Key Features
1. **Volume-Weighted RSI Calculation**:
- The core of the script calculates a volume-weighted RSI, which gives more significance to price movements associated with higher volume. This helps traders understand the strength of price movements more accurately.
2. **Abnormal Activity Detection**:
- The script includes calculations for abnormal volume and price changes using standard deviation (SD) multiples. This feature alerts traders to potential unusual activity, which could indicate upcoming volatility or market manipulation.
3. **Market Structure Filtering**:
- The script assesses market structure by identifying pivot highs and lows, allowing for better contextual analysis of price movements. This includes identifying bearish and bullish divergences, which can signal potential reversals.
4. **Color-Coded Signals**:
- The indicator visually represents market conditions using different bar colors for various scenarios, such as bearish divergence, likely price manipulation, and high-risk moves on low volume. This allows traders to quickly assess market conditions at a glance.
5. **Conditional Signal Line**:
- The signal line is displayed only when institutional activity conditions are met, remaining hidden otherwise. This adds an extra layer of filtering to prevent unnecessary signals, focusing only on significant market moves.
6. **Overbought and Oversold Levels**:
- The script defines overbought and oversold thresholds, enhancing the trader's ability to spot potential reversal points. Color gradients help visually distinguish between these critical levels.
7. **Alerts**:
- The script includes customizable alert conditions for various market signals, including abnormal volume spikes and RSI crossings over specific thresholds. This keeps traders informed in real-time, enhancing their ability to act promptly.
#### Benefits of Using the `VolWRSI` Script
- **Enhanced Decision-Making**: By integrating volume into the RSI calculation, the script helps traders make more informed decisions based on the strength of price movements rather than price alone.
- **Early Detection of Market Manipulation**: The abnormal activity detection can help traders identify potentially manipulative market behavior, allowing them to act or adjust their strategies accordingly.
- **Visual Clarity**: The use of color-coding and graphical elements (such as shapes and fills) provides clear visual cues about market conditions, which can be especially beneficial for traders who rely on quick visual assessments.
- **Risk Management**: The identification of high-risk low-volume moves helps traders manage their exposure better, potentially avoiding trades that may lead to unfavorable outcomes.
- **Reduced Noise with Institutional Activity Filtering**: The conditional signal line only plots when institutional activity conditions are detected, providing higher confidence in signals by excluding lower-conviction setups.
- **Customization**: With adjustable parameters for length, thresholds, and colors, traders can tailor the script to their specific trading styles and preferences.
Overall, the `VolWRSI` script combines technical analysis tools in a coherent framework, aiming to provide traders with deeper insights into market dynamics and higher-quality trade signals, potentially leading to more profitable trading decisions.

Z-Score RSI StrategyOverview
The Z-Score RSI Indicator is an experimental take on momentum analysis. By applying the Relative Strength Index (RSI) to a Z-score of price data, it measures how far prices deviate from their mean, scaled by standard deviation. This isn’t your traditional use of RSI, which is typically based on price data alone. Nevertheless, this unconventional approach can yield unique insights into market trends and potential reversals.
Theory and Interpretation
The RSI calculates the balance between average gains and losses over a set period, outputting values from 0 to 100. Typically, people look at the overbought or oversold levels to identify momentum extremes that might be likely to lead to a reversal. However, I’ve often found that RSI can be effective for trend-following when observing the crossover of its moving average with the midline or the crossover of the RSI with its own moving average. These crossovers can provide useful trend signals in various market conditions.
By combining RSI with a Z-score of price, this indicator estimates the relative strength of the price’s distance from its mean. Positive Z-score trends may signal a potential for higher-than-average prices in the near future (scaled by the standard deviation), while negative trends suggest the opposite. Essentially, when the Z-Score RSI indicates a trend, it reflects that the Z-score (the distance between the average and current price) is likely to continue moving in the trend’s direction. Generally, this signals a potential price movement, though it’s important to note that this could also occur if there’s a shift in the mean or standard deviation, rather than a meaningful change in price itself.
While the Z-Score RSI could be an insightful addition to a comprehensive trading system, it should be interpreted carefully. Mean shifts may validate the indicator’s predictions without necessarily indicating any notable price change, meaning it’s best used in tandem with other indicators or strategies.
Recommendations
Before putting this indicator to use, conduct thorough backtesting and avoid overfitting. The added parameters allow fine-tuning to fit various assets, but be careful not to optimize purely for the highest historical returns. Doing so may create an overly tailored strategy that performs well in backtests but fails in live markets. Keep it balanced and look for robust performance across multiple scenarios, as overfitting is likely to lead to disappointing real-world results.

Mean Trend OscillatorMean Trend Oscillator
The Mean Trend Oscillator offers an original approach to trend analysis by integrating multiple technical indicators, using statistic to get a probable signal, and dynamically adapting to market volatility.
This tool aggregates signals from four popular indicators—Relative Strength Index (RSI), Simple Moving Average (SMA), Exponential Moving Average (EMA), and Relative Moving Average (RMA)—and adjusts thresholds using the Average True Range (ATR). By using this, we can use Statistics to aggregate or take the average of each indicators signal. Mathematically, Taking an average of these indicators gives us a better probability on entering a trending state.
By consolidating these distinct perspectives, the Mean Trend Oscillator provides a comprehensive view of market direction, helping traders make informed decisions based on a broad, data-driven trend assessment. Traders can use this indicator to enter long spot or leveraged positions. The Mean Trend Oscillator is intended to be use in long term trending markets. Scalping MUST NOT be used with this indicator. (This indicator will give false signals when the Timeframe is too low. The best intended use for high-quality signals are longer timeframes).
The current price of a beginning trend series may tell us something about the next move. Thus, the Mean Trend Oscillator allows us to spot a high probability trending market and potentially exploit this information enter long or shorts strategy. (again, this indicator will give false signals when the Timeframe is too low. The best intended use for high-quality signals are longer timeframes).
Concept and Calculation and Inputs
The Mean Trend Oscillator calculates a “net trend” score as follows:
RSI evaluates market momentum, identifying overbought and oversold conditions, essential for confirming trend direction.
SMA, EMA, and RMA introduce varied smoothing methods to capture short- to medium-term trends, balancing quick price changes with smoothed averages.
ATR-Enhanced Thresholds: ATR is used as a dynamic multiplier, adjusting each indicator’s thresholds to current volatility levels, which helps reduce noise in low-volatility conditions and emphasizes significant signals when volatility spikes.
Length could be used to adjust how quickly each indicator can more or how slower each indicator can be.
Time Coherency for Inputs: Each indicator must be calculated where each signal is relatively around the same area.
For example:
Simply:
SMA, RMA, EMA, and RSI enters long around each intended trend period. Doesn't have to be perfect, but the indicators all enter long around there.
Each indicator contributes a score (+1 for bullish and -1 for bearish), and these scores are averaged to generate the final trend score:
A positive score, shown as a green line, suggests bullish conditions.
A negative score, indicated by a red line, signifies bearish conditions.
Thus, giving us a signal to long or short.
How to Use the Mean Trend Oscillator
This indicator’s output is straightforward and can fit into various trading strategies:
Bullish Signal: A green line shows that the trend is bullish, based on a positive average score across the indicators, signaling a consideration of longing an asset.
Bearish Signal: A red line indicates bearish conditions, with an overall negative trend score, signaling a consideration to shorting an asset.
By aggregating these indicators, the Mean Trend Oscillator helps traders identify strong trends while filtering out minor fluctuations, making it a versatile tool for both short- and long-term analysis. This multi-layered, adaptive approach to trend detection sets it apart from traditional single-indicator trend tools.

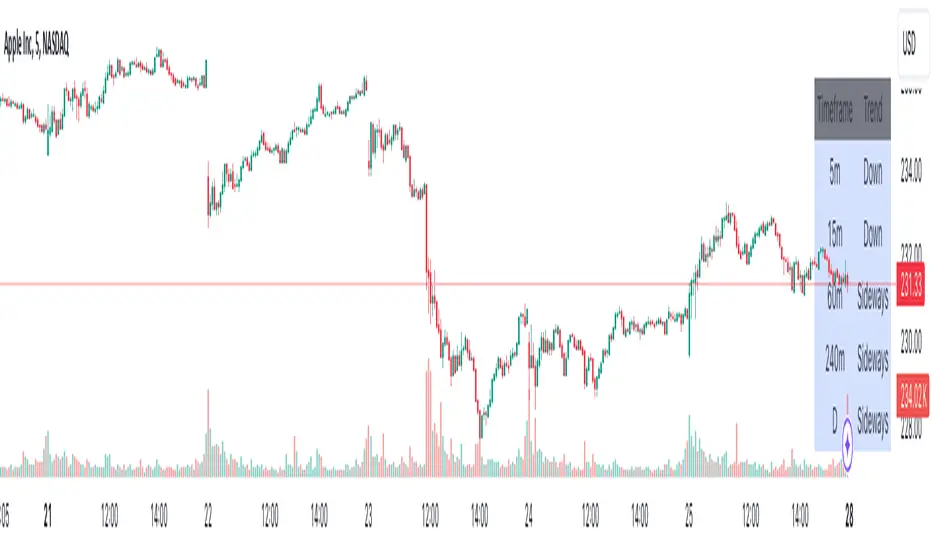
Advanced Multi-Timeframe Trend DetectorThis script is designed to provide a multi-timeframe trend analysis, combining moving averages (MAs) and the Relative Strength Index (RSI) to determine market direction across different timeframes. Here's a breakdown of what the script does:
Key Components of the Script
Inputs:
Moving Averages: Short and long moving average lengths (9 and 21 periods).
ATR and RSI Lengths: ATR (Average True Range) and RSI (Relative Strength Index) lengths set to 14 periods.
RSI Levels: Overbought and oversold levels for the RSI set to 70 and 30, respectively.
Trend Determination:
A function called trendDirection evaluates the trend based on the closing prices of the current and previous periods, as well as the RSI value.
It classifies the trend as "Up", "Down", or "Sideways" based on the conditions:
Up: Current close is higher than the previous close and RSI is below the overbought level.
Down: Current close is lower than the previous close and RSI is above the oversold level.
Sideways: If neither condition is met.
Table Creation:
A table is created at the bottom right of the chart to display the trend for different timeframes (5m, 15m, 60m, 240m, and Daily).
The table is initialized with headers and then populated with the trend results for each timeframe.
Calculating Trends for Each Timeframe:
The script fetches the current and previous close prices for each timeframe using request.security().
It calculates the RSI for each timeframe and then calls the trendDirection function to determine the trend.
Displaying Trends:
The results are displayed in a table format, with each timeframe and its corresponding trend.
Summary
Overall, this script provides a concise way to visualize market trends across multiple timeframes, using MAs and RSI to offer a more nuanced view of potential market movements. This can help traders make more informed decisions based on the prevailing trends.
Mars Signals - SSL Trend AnalyzerIntroduction
The "Mars Signals - Precision Trend Analyzer with SSL Baseline & Price Action Zones" is a comprehensive technical analysis tool designed for traders seeking to enhance their market analysis and trading strategies. This indicator integrates multiple advanced trading concepts, including dynamic moving averages, trend detection algorithms, momentum indicators, volume analysis, higher timeframe confirmation, candlestick pattern recognition, and precise price action zones. By combining these elements, the indicator aims to provide clear and actionable buy and sell signals, helping traders to make informed decisions in various market conditions.
Core Components and Functionality
1.Dynamic Baseline Calculation
Moving Average Types: The indicator allows users to select from a variety of moving average types for the baseline calculation, including Simple Moving Average (SMA), Exponential Moving Average (EMA), Hull Moving Average (HMA), Weighted Moving Average (WMA), Double EMA (DEMA), Triple EMA (TEMA), Least Squares Moving Average (LSMA), Triangular Moving Average (TMA), Kijun (from Ichimoku Kinko Hyo), and McGinley's Dynamic.
Baseline Length: Users can customize the length of the moving average, providing flexibility to adjust the sensitivity of the baseline to market movements.
Signal Line Generation: The indicator computes a dynamic signal line based on the relationship between the close price and the moving averages of the high and low prices. This signal line adapts to market volatility and trend changes.
2.SSL Baseline Integration
SSL Baseline: In addition to the primary baseline, the indicator incorporates an SSL (Semaphore Signal Level) Baseline, which further refines trend detection by considering the highs and lows over a specified period.
Dual Confirmation: The combination of the primary baseline and the SSL baseline enhances the reliability of the trend signals by requiring agreement between both baselines before generating a signal.
3.Momentum and Trend Filters
Relative Strength Index (RSI): The indicator uses the RSI to assess the momentum of price movements, filtering out signals that occur during overbought or oversold conditions.
Moving Average Convergence Divergence (MACD): The MACD is employed to identify the direction and strength of the trend, adding another layer of confirmation to the signals.
Average Directional Index (ADX): The ADX measures the strength of the trend, ensuring that signals are generated only when the market shows significant directional movement.
4.Volume Analysis
Volume Filter: An optional volume filter compares the current volume to its moving average, allowing traders to focus on signals that occur during periods of higher market activity.
5.Higher Timeframe Confirmation
Multi-Timeframe Analysis: The indicator can incorporate data from a higher timeframe, comparing the current price to the higher timeframe's baseline and signal line. This feature helps traders align their trades with the broader market trend.
6.Candlestick Pattern Recognition
Bullish Patterns: The indicator detects bullish patterns such as Bullish Engulfing, Piercing Line, Hammer, and Doji.
Bearish Patterns: It also identifies bearish patterns like Bearish Engulfing, Dark Cloud Cover, Shooting Star, and Doji.
Pattern Prioritization: The patterns are prioritized to highlight the most significant formations, which can serve as additional confirmation for trade entries and exits.
7.Price Action Zones
Support and Resistance Levels: The indicator automatically identifies pivot highs and lows to establish dynamic support and resistance levels.
Zone Visualization: It draws shaded rectangles on the chart to represent these zones, providing a clear visual aid for potential reversal or breakout areas.
ATR-Based Zone Width: The zones' thickness is dynamically calculated using the Average True Range (ATR), adjusting to the current market volatility.
Background Coloring: The chart background changes color when the price is above the maximum resistance or below the minimum support, alerting traders to significant price movements.
Interpreting the Signals
1.Buy Signals
Conditions:
Price crosses above the signal line.
RSI is below 70 (not overbought).
MACD line is above the signal line (indicating bullish momentum).
ADX is above the user-defined threshold (default is 20), confirming a strong trend.
(Optional) Volume is above its moving average if the volume filter is enabled.
(Optional) Price is above the higher timeframe baseline and signal line if the higher timeframe filter is enabled.
(Optional) A bullish candlestick pattern is detected if the candlestick pattern filter is enabled.
Visual Indicators:
An upward-pointing label with the text "BUY" appears below the price bar.
The baseline and SSL baseline lines turn to colors indicating bullish conditions.
2.Sell Signals
Conditions:
Price crosses below the signal line.
RSI is above 30 (not oversold).
MACD line is below the signal line (indicating bearish momentum).
ADX is above the user-defined threshold, confirming a strong trend.
(Optional) Volume is above its moving average if the volume filter is enabled.
(Optional) Price is below the higher timeframe baseline and signal line if the higher timeframe filter is enabled.
(Optional) A bearish candlestick pattern is detected if the candlestick pattern filter is enabled.
Visual Indicators:
A downward-pointing label with the text "SELL" appears above the price bar.
The baseline and SSL baseline lines turn to colors indicating bearish conditions.
3.Support and Resistance Zones
Interpretation:
Resistance Zones: Represent areas where the price may face selling pressure. A break above these zones can signal a strong bullish move.
Support Zones: Represent areas where the price may find buying interest. A break below these zones can signal a strong bearish move.
Background Color:
The background turns red when the price is above the maximum resistance, indicating potential overextension.
The background turns green when the price is below the minimum support, indicating potential undervaluation.
Effective Usage Strategies
1.Customization
Adjusting Baseline and SSL Settings: Traders should experiment with different moving average types and lengths to match their trading style and the specific characteristics of the asset being analyzed.
Filtering Parameters: Modify RSI, MACD, and ADX settings to fine-tune the sensitivity of the signals.
Volume and Higher Timeframe Filters: Enable these filters to add robustness to the signals, especially in volatile markets or when trading higher timeframes.
2.Combining with Other Analysis
Fundamental Analysis: Use the indicator in conjunction with fundamental insights to validate technical signals.
Risk Management: Always apply proper risk management techniques, such as setting stop-loss and take-profit levels based on the support and resistance zones provided by the indicator.
3.Backtesting
Historical Analysis: Utilize the indicator's settings to backtest trading strategies on historical data, helping to identify the most effective configurations before applying them in live trading.
4.Monitoring Market Conditions
Volatility Awareness: Pay attention to the ATR and ADX readings to understand market volatility and trend strength, adjusting strategies accordingly.
Event Considerations: Be cautious around major economic announcements or events that may impact market behavior beyond technical indications.
Indicator Inputs and Customization Options
Baseline Type and Length: Select from multiple moving average types and specify the period length.
ADX Settings: Adjust the length, smoothing, and threshold for trend strength confirmation.
Volume Filter: Enable or disable the volume confirmation filter.
Higher Timeframe Filter: Choose to incorporate higher timeframe analysis and specify the desired timeframe.
Candlestick Patterns: Enable or disable the detection of candlestick patterns for additional signal confirmation.
SSL Baseline Type and Length: Customize the SSL baseline settings separately from the primary baseline.
Price Action Zones Settings:
Zone Thickness: Adjust the visual thickness of the support and resistance zones.
Lookback Period: Define how far back the indicator looks for pivot points.
ATR Multiplier for Zone Width: Set the multiplier for ATR to determine the dynamic width of the zones.
Maximum Number of Zones: Limit the number of support and resistance zones displayed.
Pivot Bars: Customize the number of bars to the left and right used for identifying pivot highs and lows.
Conclusion
The "Mars Signals - Precision Trend Analyzer with SSL Baseline & Price Action Zones" is a versatile and powerful tool that amalgamates essential technical analysis techniques into a single, user-friendly indicator. By providing clear visual signals and incorporating multiple layers of confirmation, it assists traders in identifying high-probability trading opportunities. Whether you are a day trader, swing trader, or long-term investor, this indicator can be tailored to suit your trading style and enhance your decision-making process.
To maximize the benefits of this indicator:
Understand Each Component: Familiarize yourself with how each part of the indicator contributes to the overall signal generation.
Customize Thoughtfully: Adjust the settings based on the asset class, market conditions, and your risk tolerance.
Practice Diligently: Use demo accounts or paper trading to practice and refine your strategy before deploying it in live markets.
Stay Informed: Continuously educate yourself on technical analysis and market dynamics to make the most informed decisions.
Disclaimer
Trading financial markets involves risk, and past performance is not indicative of future results. This indicator is a tool to aid in analysis and should not be the sole basis for any trading decision. Always conduct your own research and consider consulting with a licensed financial advisor.

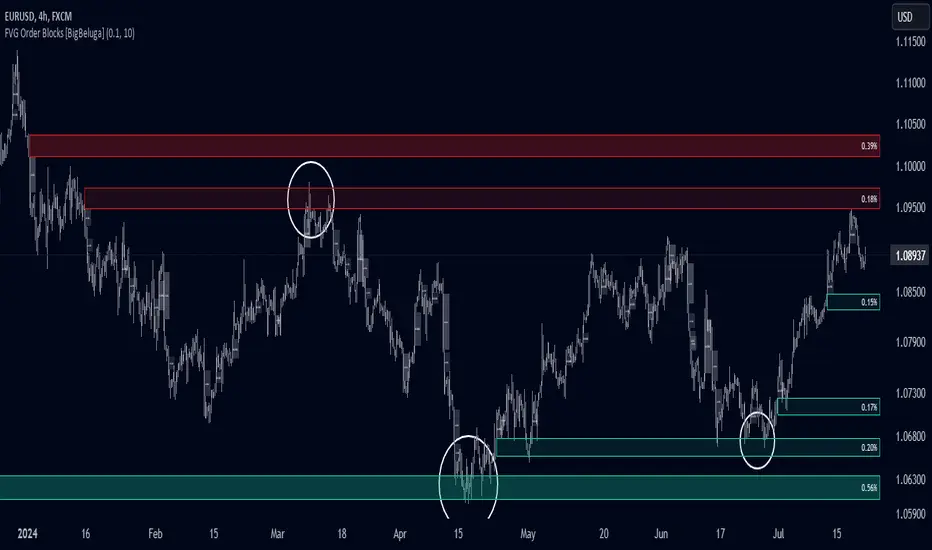
FVG Order Blocks [BigBeluga]This indicator is an advanced tool designed to detect and visualize market FVGs with order blocks, where the price action has created gaps due to strong buying or selling pressure. These FVG often act as critical support and resistance levels, giving traders strategic points for potential entries and exits. The indicator not only identifies these imbalances but also displays their relative strength by size %, helping traders prioritize order blocks that are more likely to hold or break.
The indicator works on various pairs and stocks, it also works on charts that do not provide volume data
Forex (JPY/USD):
Stocks (NVDA):
🔵 KEY FEATURES & USAGE
● FVGs Detection and Visualization:
The indicator detects bullish and bearish FVGs. Bullish FVG occur when there is significant buying, and order block is plotted below the FVG zone:
Conversely, bearish FVG are plotted with an order block above the zone, indicating potential resistance.
Traders can use these order blocks to anticipate price reactions when the market revisits these areas, making them ideal for setting up trades.
● FVG Filtering:
The indicator includes a FVG % filter that allows traders to only display strong order blocks. This ensures that only significant FVG order blocks are shown, reducing noise and focusing on the most impactful areas.
● Highlighting Broken Levels:
When an imbalance level is broken—either breached by price action or no longer relevant—the indicator can either delete the level or mark it with a gray color areas. This provides a clear visual cue that the level has been compromised, allowing traders to adjust their strategies accordingly.
● Order Blocks Signals:
When price retest the blocks, indicator display potential sell or buy signals. Which can be an opportunity for trades
🔵 CUSTOMIZATION
● FVG Filter:
Adjust the strength filter to control which FVGs are displayed based on their percentage size. This filter helps in focusing only on significant blocks that are likely to impact price action.
● Order Blocks Amount Displayed:
Set the maximum number of Order Blocks to be displayed on the chart. This customization helps keep the chart clean and ensures that only the most important blocks are in view.
● Broken Order Blocks Display:
Choose whether to display order blocks that have been broken by the price. This feature helps in maintaining a focus on blocks that are still valid while filtering out those that are no longer relevant.
● Color Customization:
You can customize the colors for bullish and bearish Order Blocks to match your chart's overall color scheme. Additionally, strength bars can be color-coded based on their percentage to quickly identify high-priority order blocks.
Traders who are confident in the settings of the indicator can confidently use it on various types of markets
Stochastic RMIThe Relative Momentum Index (RMI) is a technical analysis indicator used to analyze the price movements of assets in a financial market. Similar to the RSI (Relative Strength Index), it helps measure the momentum and strength of the asset's price movements over the recent period. However, the RMI offers a "smoother" view, unlike the RSI. This means that there is less "noise" in the indicator.
As is known, the Stochastic RSI indicator is based on the RSI. What I did was to create a stochastic based on the RMI. If you compare this indicator with the "Stochastic RSI", you will see that there is no difference between them, except that the "Stochastic RMI" is more "smooth" and noiseless.
